The Essence of the System
The mining operations planning system helps consolidate in one place budget, plan, actuals, key metrics and see what is really happening in production – where deviations occurred, why they arose – all without complex spreadsheets and scattered data.
The Problem
Planning exists at every production site — it is essential. But its quality often raises questions.
We often see the same picture: the annual plan is simply divided into equal monthly portions — and that is it. On top of that, risks are built into the numbers in advance «with a safety margin», to make the plan realistically achievable.
Then the hardest part begins: as soon as actual working conditions change, the plan quickly becomes outdated;
- equipment downtime, rescheduled blasts, or changes to the mining face require constant manual adjustments;
- recalculating metrics and gathering information manually begins;
- actual data comes from different sources and often with delays;
- to understand the cause of deviations, you have to consolidate data from multiple files, reports, and systems;
- a significant portion of time is spent not on managing the process, but on trying to understand what is actually happening in production at the current moment.
As a result, a lot of time is spent not on making decisions, but simply trying to understand what is really going on and where exactly the deviation occurred.
How Does It Work?
You work not with abstract numbers, but with familiar production logic.
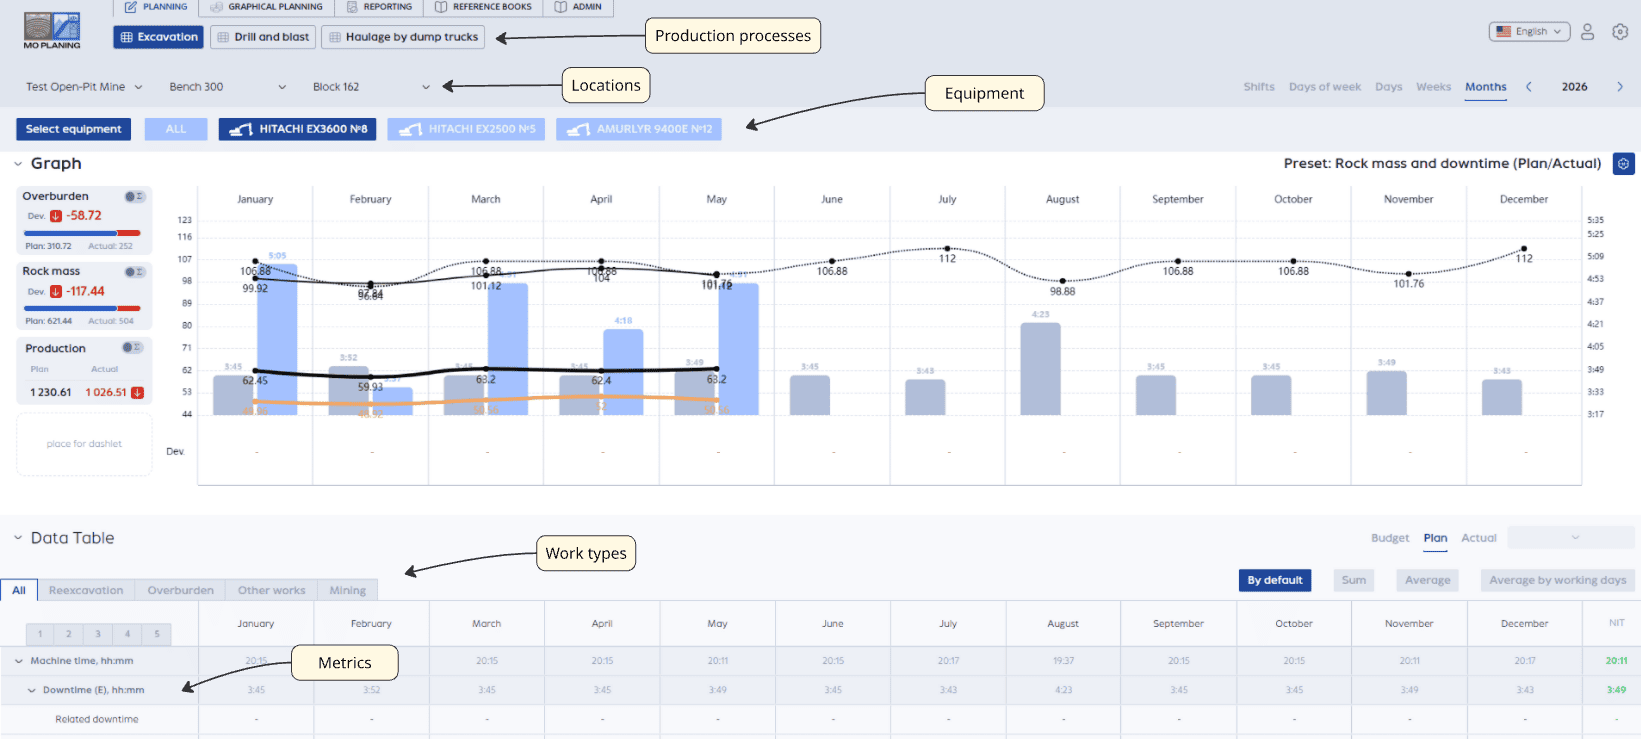
In the system, the production process is divided into stages — for example:
- drilling and blasting
- excavation
- hauling
Within each stage, you define work types (mining, stripping, etc.) and create metrics, by which planning is conducted – for example:
Next, you define where exactly this takes place (you set up the location structure), for example: Pit, Bench, Block.
And which equipment performs the work (you select specific equipment or equipment groups).
And that is it! From here, you work in a familiar rhythm:
- set the plan for a month or a day
- enter actual data as needed
- and immediately see how it affects the other metrics
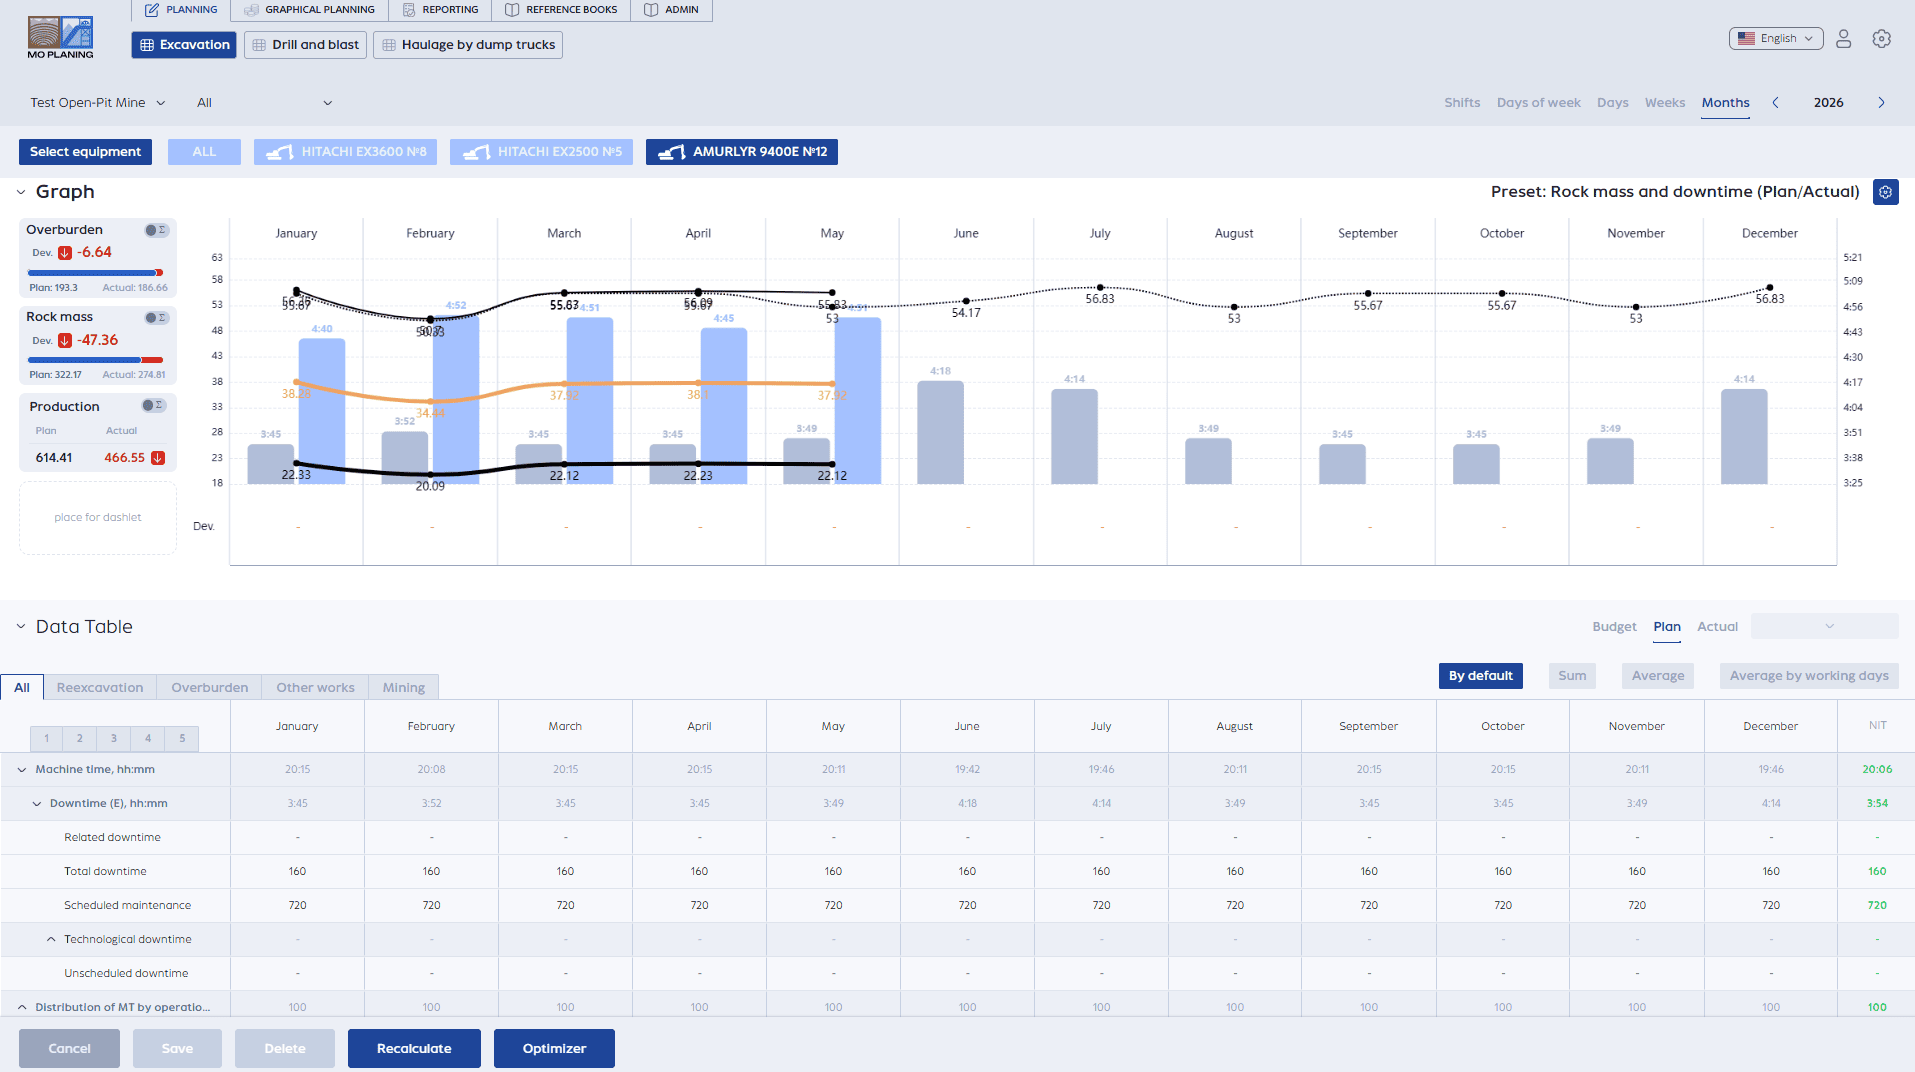
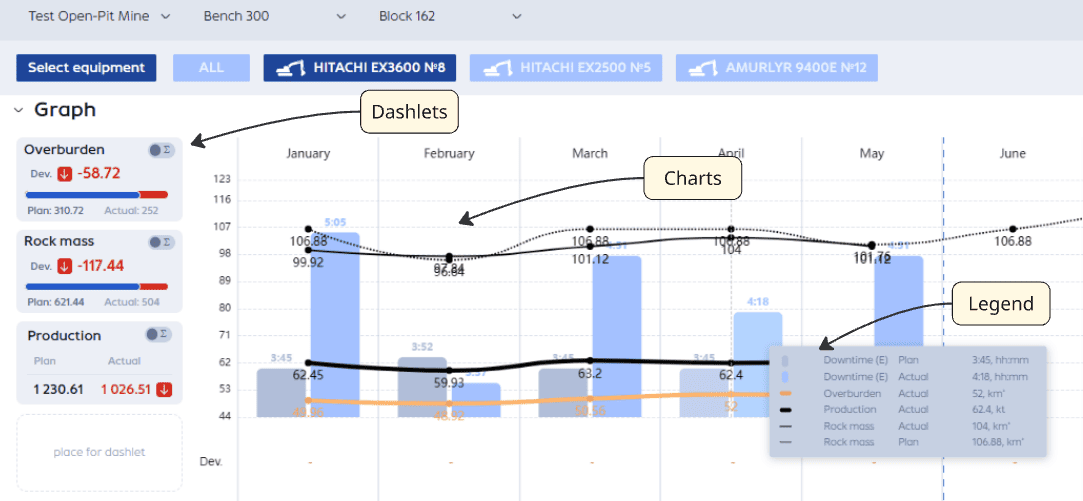
The top part of the screen shows the dynamics — charts, legend, dashlets by selected metrics:
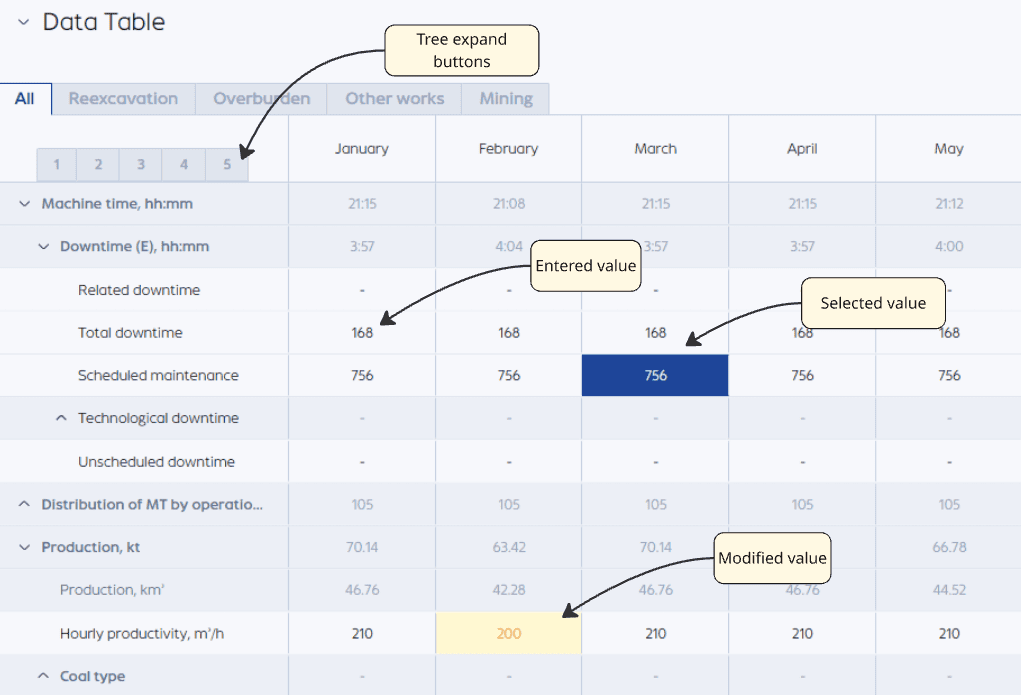
The bottom part is a work table where you can enter and adjust metric values as easily as in Excel.
At the same time, most of the routine work happens automatically:
- if you change, for example, the mining volume — the system will automatically recalculate productivity;
- metrics can be displayed in whatever way is convenient for analysis: for example, total volume for the month or monthly average;
- if the plan is entered for the entire month at once — the system will automatically distribute it across days, so you do not have to fill in each day manually.
You can switch at any time between the plan, actuals, or any other scenario.
How the System Helps in Practice
Beyond basic planning, the system has tools that genuinely help you understand the process, rather than just recording numbers.
Factor Analysis — Why It “Didn’t Add Up”
When the plan does not match the actuals, a lengthy investigation usually begins: where exactly is the deviation, what caused it, what was the impact.
Here it is done much more simply. You select a metric (for example, mining volume) and immediately see which factors changed it.
The system breaks down the result into components: what contributed positively, what contributed negatively — by metrics, work types, and equipment.
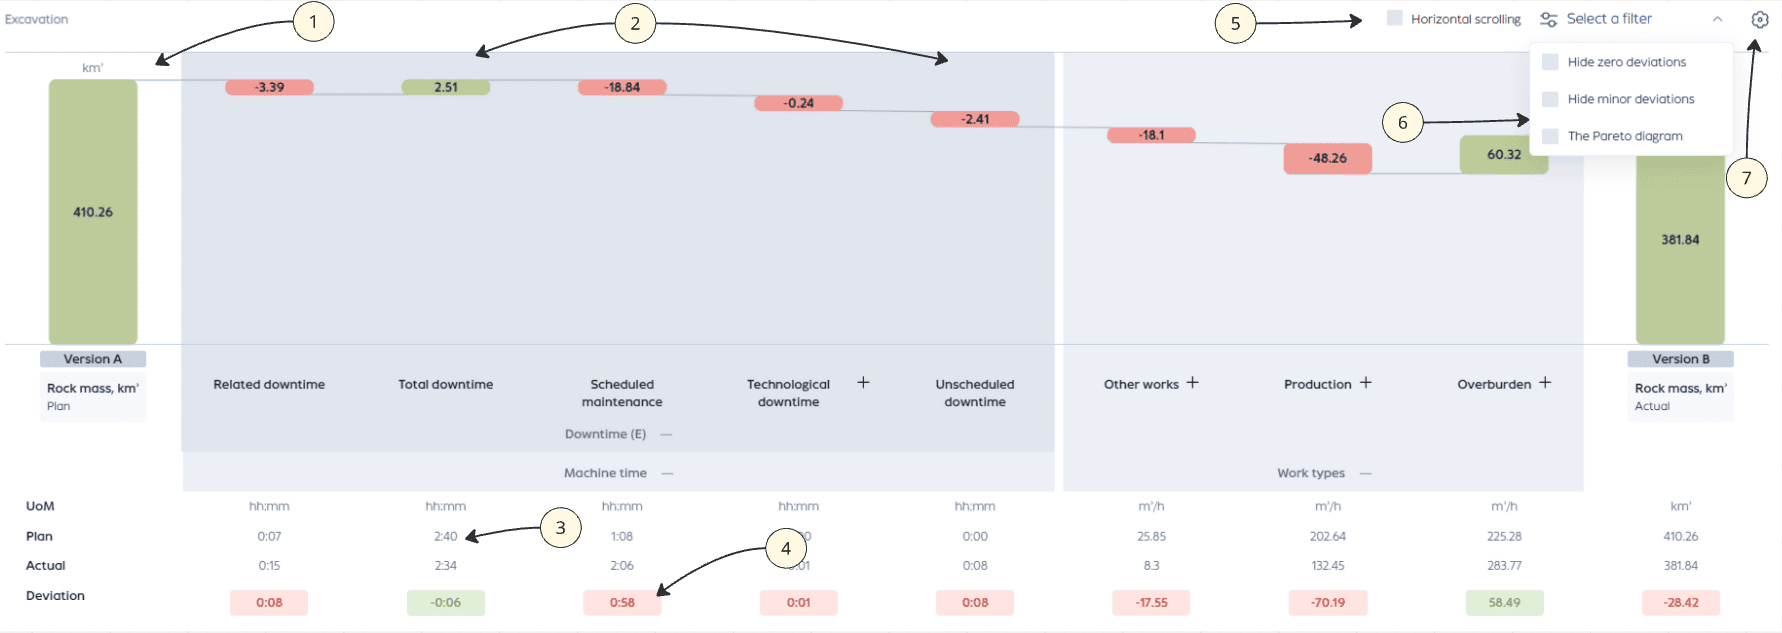
- On the left and right, the analyzed metric is displayed — in this case, rock mass: plan on the left, actuals on the right
- Between them are the internal metrics, from which the final result is formed, and their contribution to the change in the main metric
- Below each bar, the plan and actual values
- Deviation between plan and actuals: green — positive impact, red — negative, with the deviation magnitude shown
- For convenience, horizontal scrolling appears if all metrics do not fit on the screen when expanded
- Filters allow you to hide zero or insignificant deviations and focus on key changes
- In settings, you can specify the production stage, the metric being analyzed, and the comparison scenario (for example, plan vs. actuals or other plan versions)
You can drill down deeper and look at specific root causes. Without manual calculations and endless spreadsheets.
Planogram — Equipment Allocation and Work Execution Results
This is a visual representation of equipment operations:
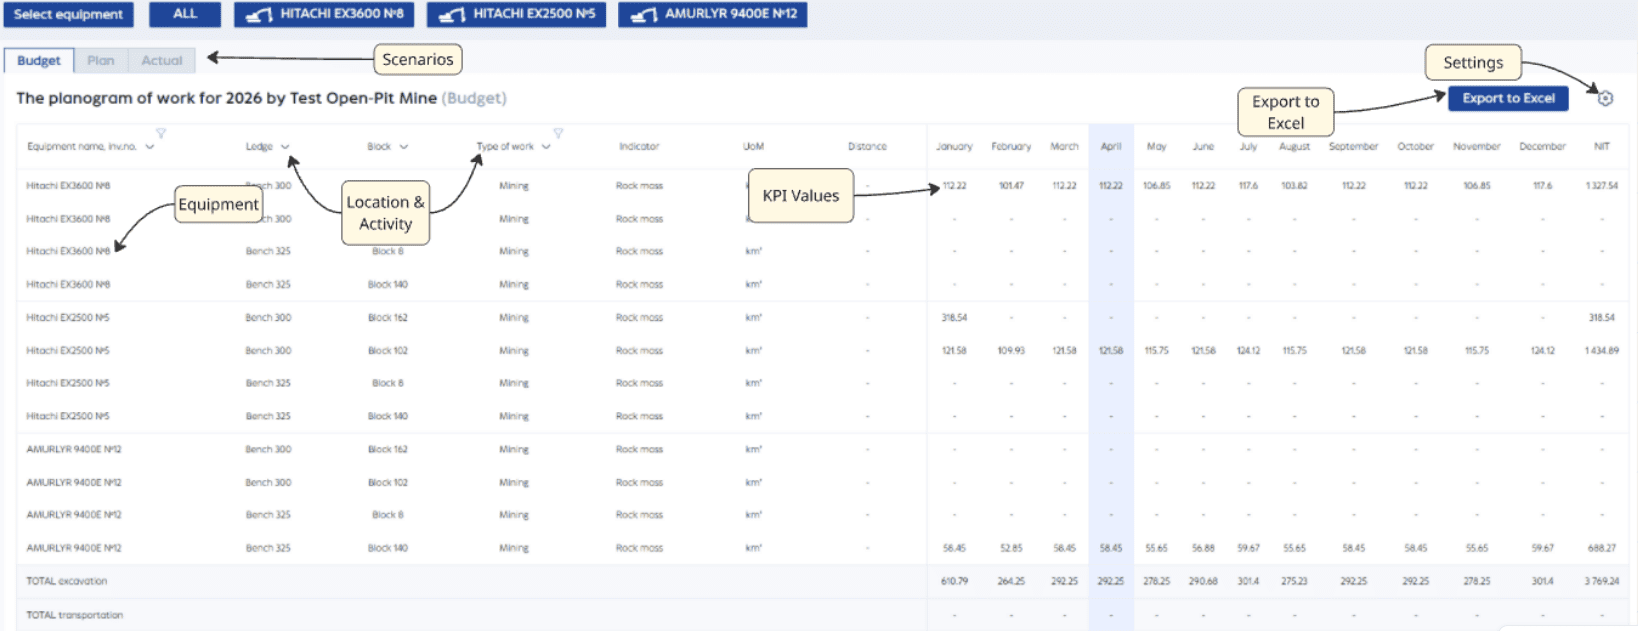
You see:
- which excavators are working and which haul trucks are assigned to them
- where and which work types are being performed
- and which metrics are produced as a result
All of this is shown by periods — by month or by day.
This is convenient when you need to quickly understand: where equipment is overloaded and where it is idle. Or simply to present the overall picture to management.
Additionally, you can select a scenario on the screen — plan, actuals, or another calculation version.
The planogram can be exported to Excel for further work.
Separately, there are display settings. In them, you can flexibly configure the desired report view.
Graphical Planning — Seeing the Process “On the Ground”
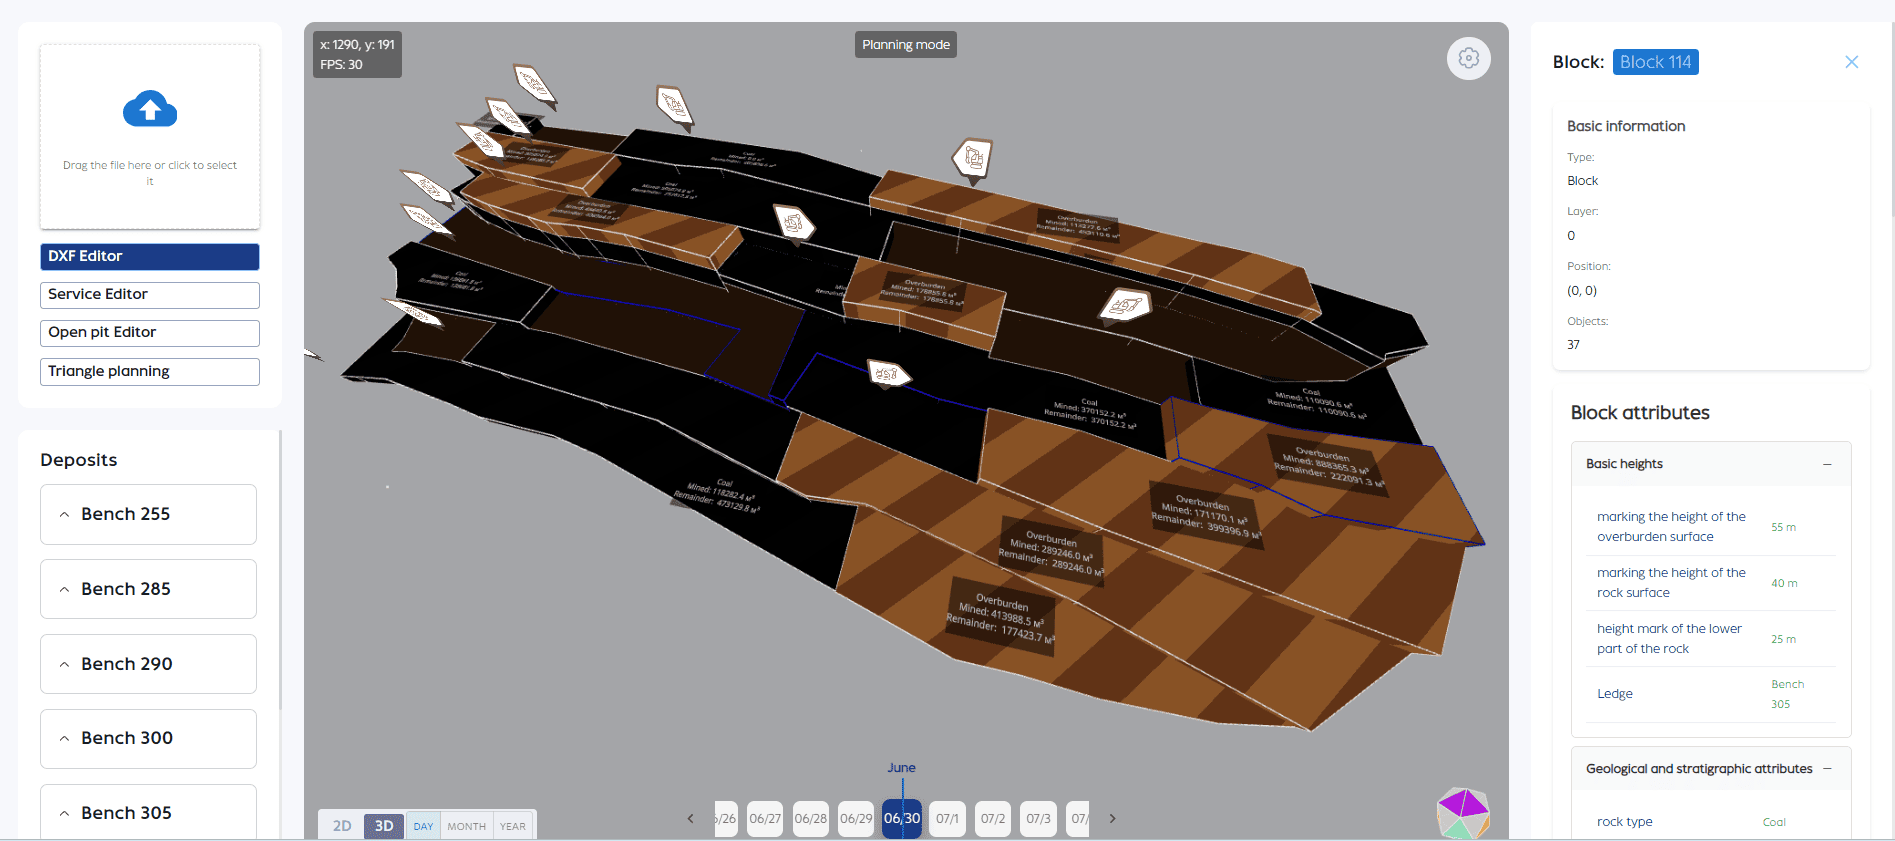
If spatial data is available (for example, a pit model), you can work not only with tables but also with a visual map.
The screen can display:
- blocks, benches, areas
- volumes — how much has been mined and how much remains
- detailed object characteristics
- equipment positions
This provides an understanding of not only “how much”, but also “where exactly it is happening”.
Formula Editor — How Metrics Are Calculated
In any planning system, the main question is: “how was this actually calculated?”
Here the calculation logic is transparent.
You define the formulas for the metrics yourself.
The editor is intuitive — no programming required. You can set up a formula once, and then the system will automatically calculate everything on its own.
This is especially important when each process has its own logic.
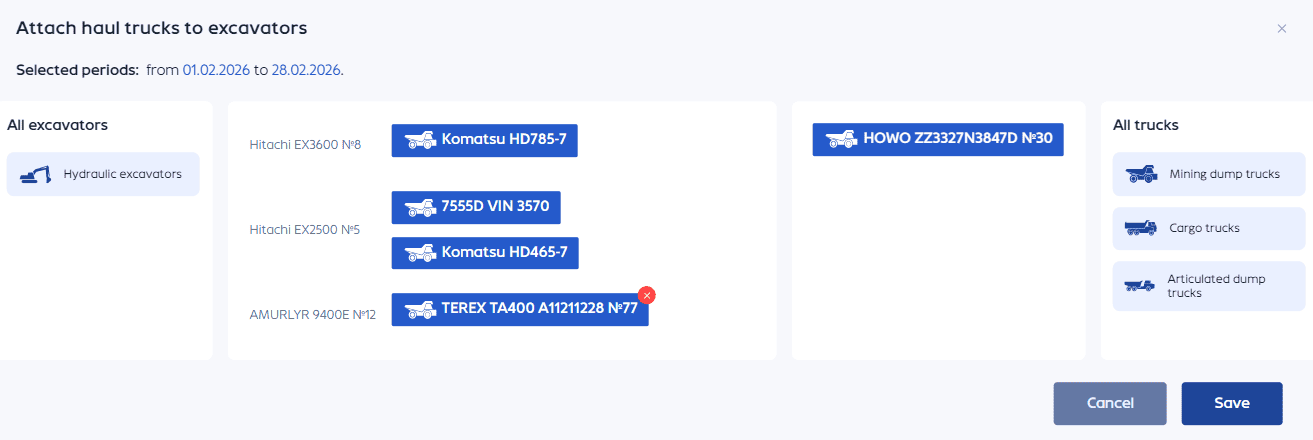
Haul Truck-to-Excavator Assignment — Managing Equipment Utilization
You simply select a period and assign haul trucks to excavators.
You can quickly set up the required pairings and immediately see how it affects the metrics. The system also indicates whether all excavators are adequately served by transport.
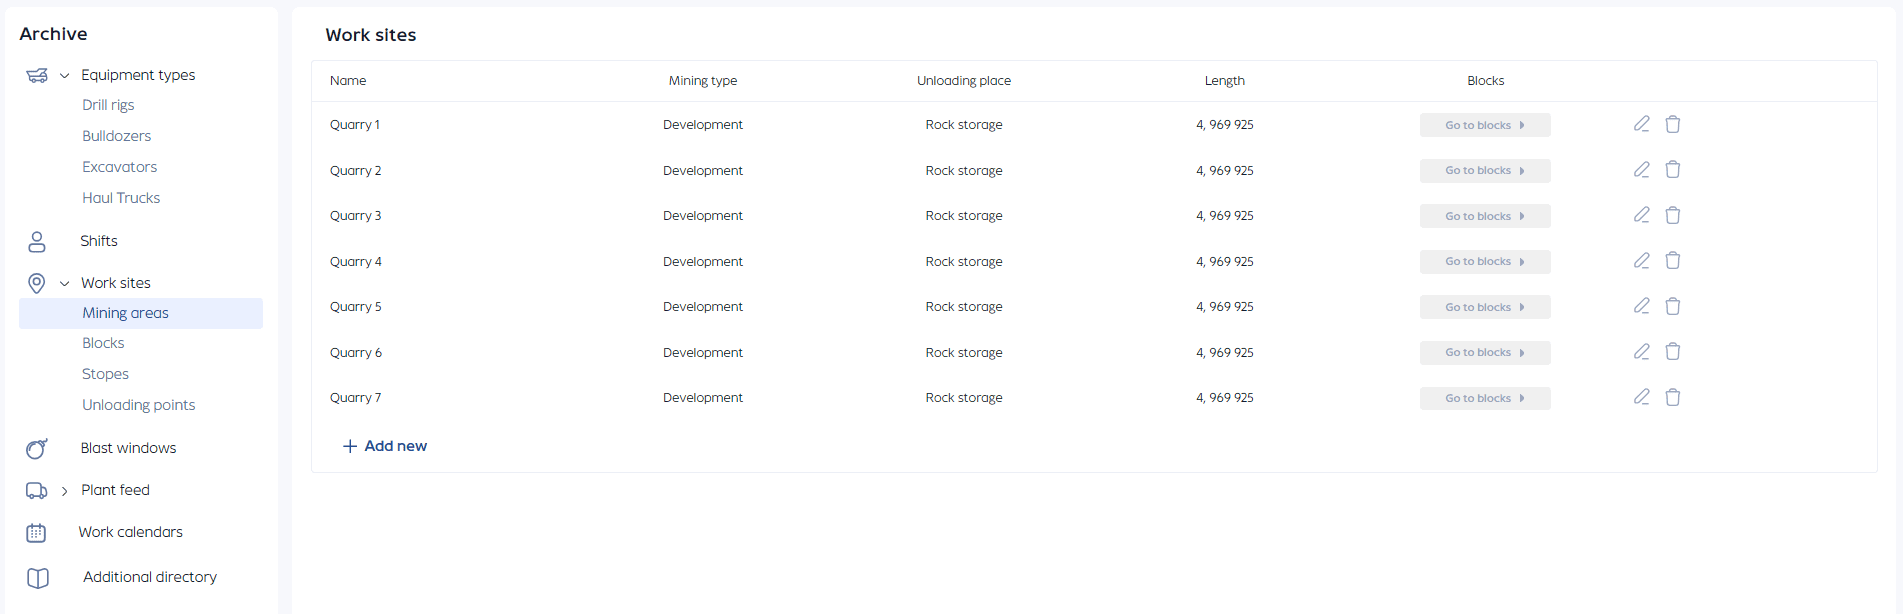
Reference Data — Configuring the System to Your Needs
You can flexibly configure reference data:
- equipment types and fleet composition — excavators, haul trucks, and any other units of machinery
- shifts — with specified duration for accurate planning
- work locations — areas, blocks, unloading points
- blast schedules — to account for restrictions and downtime
- routes and shipments to the processing plant — factoring in distances and directions
- work calendars — with different operating schedules and days off
- downtime – repairs, relocations, standby reserves, etc.
Who Is This Service For?
- Dispatchers and production staff — to see the real equipment workload and not piece together the picture from fragments.
- Engineers and planners — to avoid recalculating metrics manually and to comfortably model different scenarios.
- Management — to understand at any moment where deviations occurred and what caused them, without diving into dozens of spreadsheets.
Summary
If your work involves plans, a linear production process, and constant changes — you most likely already understand how the System can simplify your work.